Learning
Center
|


 |
Model
Portfolio
|


 |
|
|
GCM Model Portfolio
Globe Capital Management, Corp., being committed to
trading excellence is constantly refining its strategies by learning from
proven sources of trading mastery, as well as its own past mistakes. Part
of our quest for improvement involves actual trading experience. GCM's
Model Portfolio is our showcase of what we believe to be, sound trading
practices. However, this should NOT be construed as rendering any
investment advise, nor a recommendation of any techniques, products or
services, or to buy or sell specific securities. We firmly agree in Van K
Tharp belief that, the secret of the "Holy Grail" is found
within one self.
Portfolio
Statistics
Since
Inception as of 10/31/02*
|
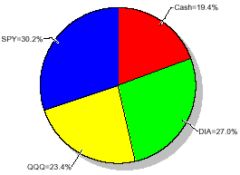
Current
Allocation
|
|
 |
Performance
 |
GCM
Portfolio |
S&P
500 |
|
|
Month
to date |
9.39% |
14.85% |
|
Quarter
to date |
9.10% |
14.85% |
|
Year
to date |
-0.72% |
-18.45% |
|
|
1
Year |
-0.75% |
-17.88% |
| 3 Years |
N/A |
N/A |
| 5 Years |
N/A |
N/A |
| 10 Years |
N/A |
N/A |
| Since Inception |
4.26% |
-8.52% |
|
Reward/Risk
|
| Best Quarter |
4Q
2001 |
5.73% |
| Worst Quarter |
2Q
2002 |
-7.13% |
| Best Year |
|
N/A |
| Worst Year |
|
N/A |
| Annual
Return |
4.26% |
| Max. drawdown |
15.39% |
| Reward/Risk
Ratio |
0.28 |
| Standard
deviation |
3.64% |
|
Reliability**
|
|
Total Closed Trades |
30 |
|
Winning Trades |
19 |
|
Losing Trades |
11 |
|
Reliability |
63.33% |
|
Expectancy**
|
|
Expectancy |
Total |
Per Trade |
Avg |
|
Positive |
8.60 |
0.29 |
0.45 |
|
Negative |
-9.44 |
-0.31 |
-0.86 |
|
Net |
|
-0.03 |
|
|
|
|
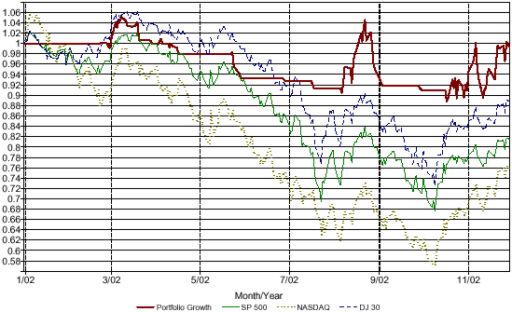
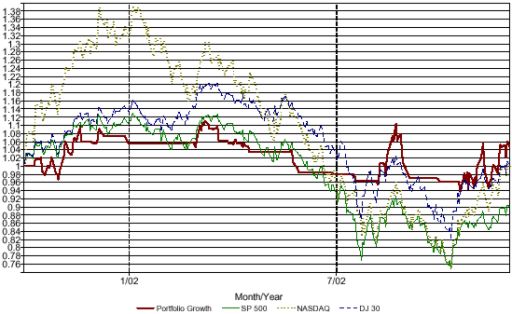
Performance
Charts
|
|

Year
to Date
|
|

Since
Inception
|
* Updated monthly. Charts and data processed with
Captools software and proprietary spreadsheets. Performance
net after management fees. Certain fixed expenses and taxes
excluded. 1,3,5, 10 Years, and since inception returns are
annual compounded. 1,3,5, and 10 Years figures are based on
trailing periods. Standard deviation based on latest 12 month trailing period
** Updated only when one or more open positions
are closed.
|
|