1st Quarter,
2002
March 29, 2002
Right after an interesting
period last year, a dull quarter followed. Our system kept the portfolio
in cash until the last days of February, when an apparent continuation of
the rally developed for a few days. However, by mid March, the resumption of
the down path left the account with barely enough gains to cover for the
fees. During this period, management decided to automate the trading
process, even if the commissions will increase from 7 to 12 (an increase
of 71.43%). This decision has taken out the emotions from the process of
executing trades.
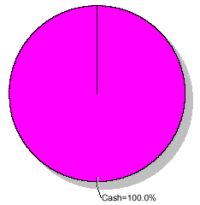
Again, as noted in the allocation chart,
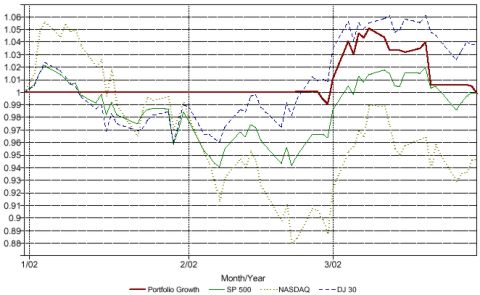
the period ended with the account balance 100% in cash. The drop at the
end of the performance chart reflect the impact of the management fees on
the portfolio.
Also, during this quarter, our
system was tested from the short side of the market and as a result of it,
short selling will be incorporated to our strategy starting the next
quarter.
In the short term, we expect
our returns to be diminished by the decision to implement the use of stop
orders despite the fact that our account equity has not grown enough. However, we
believe that such a step will be ultimately beneficial to our portfolio by
making the whole system less exposed to emotional breakdowns.