4th Quarter,
2001
December 31,
2001
Since our model portfolio
started during the last quarter of the year, this quarterly report will
also be our year-end report.
The first reporting period of
our model portfolio coincided with a major turning point in the U.S.
markets. After the terrorist attacks of September 11, the markets, already
plunging, entered into a free fall, leading to the recent lows on
September 21. The following week a strong and volatile rally started. Over
the following weeks, the major indexes staged a series of follow through
days,
(as defined by Investor's Business Daily) confirming the new direction.
Our system, being based upon
the concept of market confirmations (as opposed to market predictions,
which are based on opinions), will always be "late" in its
entry, because, at turning points, we wait for our trend indicators to
signal the new trend in its weekly study. Furthermore, one of our core beliefs
that says that it is necessary to give some gains back in order to capture potential
big moves, make us not to attempt jumping at the top. We always wait
for the market to trigger our stops. This might be perceived as a drawback
that inevitably leads to underperformance. However, one of the key
features of our system is that it enters the markets when the downside risk
is at its lowest, and exits them when the risk of cutting our gains short
is at its lowest. Additionally, our system will keep most of our gains
during periods of adverse conditions.
During most of this quarter,
the market has been in an up-trend mode, although with wild volatility.
The performance of our model portfolio was negatively impacted by initial
errors in the implementation of the system. Mainly, a last minute
adjustment in stops management. Changes that were not part of the
preliminary study and therefore introduced doubts at moments in which
swift and decisive action was needed. Another big mistake involved a lack
of discipline in the execution of trading signals. Although this last
issue can be solved by the means of using stop orders (with higher
commissions), it reveals that personal improvement is necessary.
Discretional exits were used
during the Thanksgiving long weekend, and during the year-end holiday, as
the portfolio manager went on vacation. At the end of November, a
non-regular deposit in the mid 3 figures was made. As noted in the allocation chart,
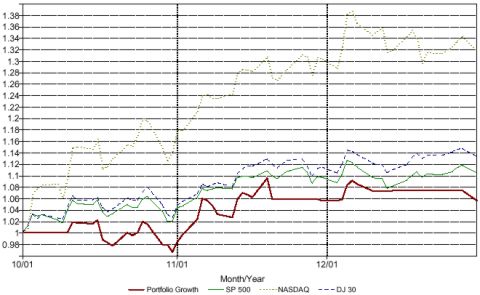
the period ended with the account balance 100% in cash. The drop at the
end of the performance chart reflect the impact of the management fees on
the portfolio.
Trading watch will
resume on January 2, 2002. Happy New Year!