2nd Quarter,
2002
June 28, 2002
The dull 1st quarter was
followed by an interesting one. The results of our initial experiments with short selling were
not exactly good and we decided to sit out the slide for the rest of the
downtrend. However, since it is our belief that our system can be used on
the short side, we kept experimenting short selling on paper and we will resume using
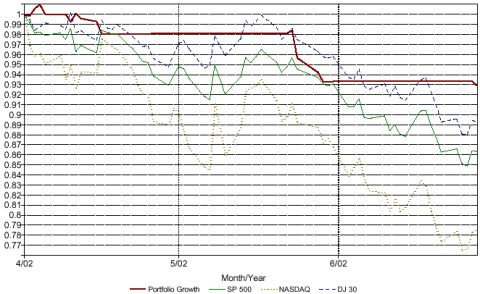
in right after the next up-trend tops. On late May a rally attempt failed,
dragging down our portfolio about 5%. However, our system kept the
losses to a minimum and by the end of the quarter we are outperforming the
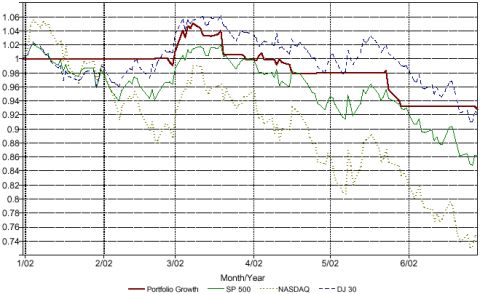
S&P 500 by 6.54% even after management fees. For the year, our portfolio
is doing 6.61% better than the big cap index. While having a negative
return is nothing to be proud of, we are satisfied with the relatively low
risk we are taking, considering that we use leverage up to the maximum
amount allowed, in accordance with the position sizing algorithm of our
system.
During this quarter we also
made a review of our stop monitoring system used during the last quarter
of 2001 and decided to make some adjustments oriented to give our trades
more room to jiggle, thereby reducing churning and increasing the
possibilities to have larger reward/risk ratios. Another change that was
introduced will affect the periodicity of the charging of profit fees.
Currently this fee is charged at the end of the quarter. From now on, it
will be charged once a year, 2 business days prior to the last business
day of the fiscal year-end for the Fund, December 31.